

Teacher's Guide to Test Grading
Set up tests, generate grade charts, and apply curves — a practical workflow for classroom grading
Setting Up a Test
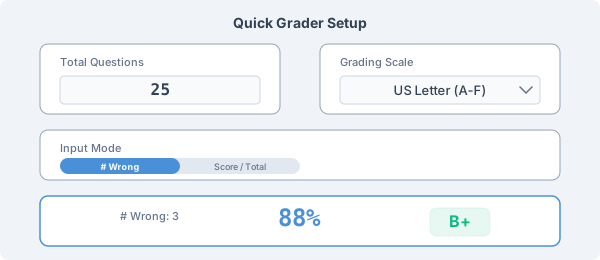
Start by entering the total number of questions or points in your test. Then choose a grading scale — the calculator includes 11 built-in scales plus a custom editor.
For grading papers, use the "# Wrong" input mode: enter how many questions the student got wrong and the calculator shows the grade instantly. For checking a student's score, use "Score / Total" mode: enter the points earned directly.
Both modes produce the same result — choose whichever matches your workflow.
Using the Grade Chart
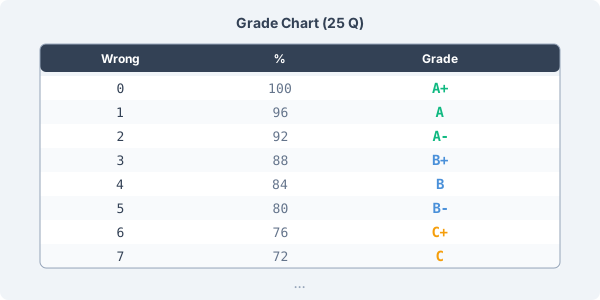
Click "Show Grade Chart" to generate a complete lookup table for your test. The chart lists every possible score with its corresponding percentage and grade, ready to print or save.
This eliminates manual calculation during grading — just look up the number of wrong answers and read off the grade. The chart adapts to whichever grading scale you have selected, so switching from US Letter to Italian School instantly regenerates the table.
Adjusting Grades with Curves
When a test turns out harder than expected, the Curve mode lets you adjust all scores mathematically. Choose from four methods:
• Linear: Add a fixed number of points to every score (e.g., +5 to all) • Percentage: Increase every score by a percentage (e.g., +10%) • Square root: Apply √(score × 100) — boosts low scores more than high ones • Highest-as-100: Scale so the top scorer gets 100% and everyone else adjusts proportionally
Enter your class's raw scores and see the curved results side by side. The method you choose depends on how the scores are distributed — square root is gentlest on top performers while linear is the most straightforward.
Ready to Calculate?
Try the grade calculator now — enter your scores and see your grades instantly.
Open Grade Calculator