

How to Use the Waveform Visualizer
See your sound waves in real-time
Open Visualizer
Starts with 440 Hz sine wave visualization
What the Visualizer Shows
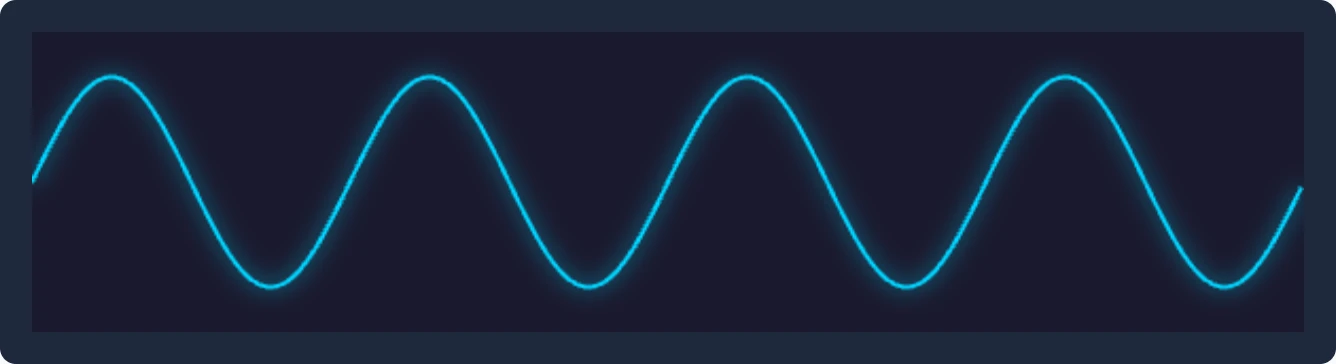
The waveform visualizer displays your audio signal in real-time, showing the characteristic shape of each waveform type:
- Real-time waveform display with grid overlay
- Stable display using zero-crossing detection
- Adaptive cycle display based on frequency
- A live readout of the current frequency, period, and signal level
Waveform Shapes



How to Use
- The waveform panel sits below the controls and is shown by default — use its Show/Hide toggle to collapse or reveal it
- Press Play to start generating audio
- Try different waveform types to see their shapes
- Adjust frequency to see how cycles change
Pro Tip: Higher frequencies show more cycles in the display. Lower frequencies show fewer, larger waves.
Ready to Generate Tones?
Open Visualizer
Advertisement